Difference between revisions of "EventHeatMap"
| Line 4: | Line 4: | ||
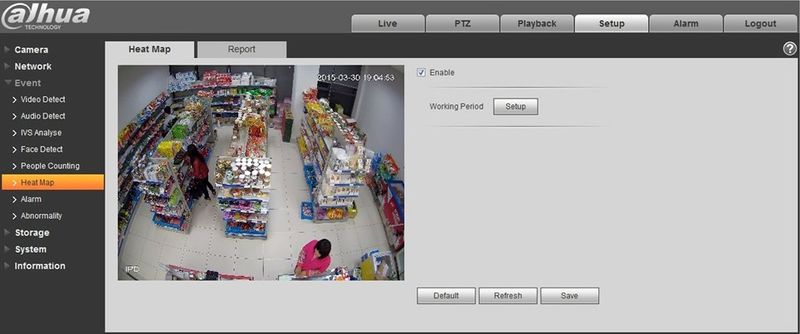
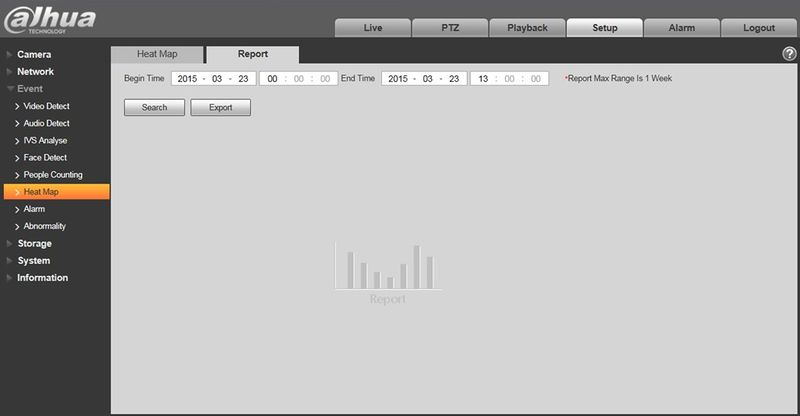
Statistics of the monitoring view heat, which can form report. The color range is from blue to red, blue means the min heat value; red means the max heat value. Original data of the heat map will be removed if mirror, angle of view changes. | Statistics of the monitoring view heat, which can form report. The color range is from blue to red, blue means the min heat value; red means the max heat value. Original data of the heat map will be removed if mirror, angle of view changes. | ||
| + | |||
| + | [[Category:IVS]] | ||
| + | [[Category:IP_Camera]] | ||
| + | [[Category:Record_Setup]] | ||
Latest revision as of 21:59, 10 March 2016
Heat Map
Statistics of the monitoring view heat, which can form report. The color range is from blue to red, blue means the min heat value; red means the max heat value. Original data of the heat map will be removed if mirror, angle of view changes.

