Difference between revisions of "Test Pbars"
| (One intermediate revision by the same user not shown) | |||
| Line 1: | Line 1: | ||
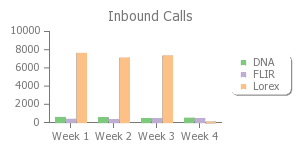
<pbars size=300x150 title="Inbound Calls" | <pbars size=300x150 title="Inbound Calls" | ||
| − | ymin=0 ymax= | + | ymin=0 ymax=10000 legend> |
,DNA,FLIR,Lorex | ,DNA,FLIR,Lorex | ||
Week 1,537,334,7579 | Week 1,537,334,7579 | ||
| Line 7: | Line 7: | ||
Week 4,461,389,0 | Week 4,461,389,0 | ||
</pbars> | </pbars> | ||
| + | |||
| + | |||
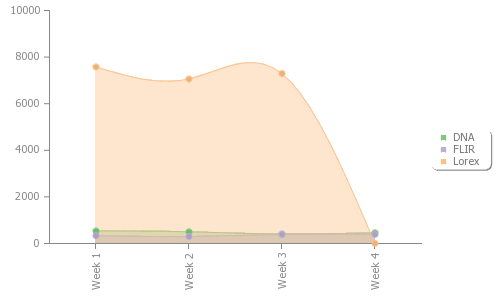
| + | ==Test2== | ||
| + | <pLines ymin=0 ymax=10000 axiscolor=888888 cubic filled | ||
| + | angle=90 plots legend> | ||
| + | ,DNA,FLIR,Lorex | ||
| + | Week 1,537,334,7579 | ||
| + | Week 2,501,300,7063 | ||
| + | Week 3,406,391,7292 | ||
| + | Week 4,461,389,0 | ||
| + | </pLines> | ||
Latest revision as of 17:07, 8 March 2019
Test2