Difference between revisions of ":Heat Map"
| Line 78: | Line 78: | ||
*Camera added to the SmartPSS | *Camera added to the SmartPSS | ||
*Latest firmware | *Latest firmware | ||
| + | ===Video Instructions=== | ||
| + | <embedvideo service="youtube">https://youtu.be/o4yIZL3BjkY</embedvideo> | ||
| + | |||
====Step by Step Instructions==== | ====Step by Step Instructions==== | ||
1. Click on the Heatmap in SmartPSS. | 1. Click on the Heatmap in SmartPSS. | ||
Revision as of 21:41, 1 February 2017
Contents
Heat Map
Description
Function Description: It supports people crowd density statistics within the set time range, and presents in the space with different colors. Color level is divided into red, orange, yellow, green and blue, which means the crowd density ranges from high to low, red means high density, blue means low density.
Prerequisites
- IVS capable device with heat map feature
- IP Address of device
- IE (Internet Explorer)
- Latest firmware
Video Instructions
Step by Step Instructions
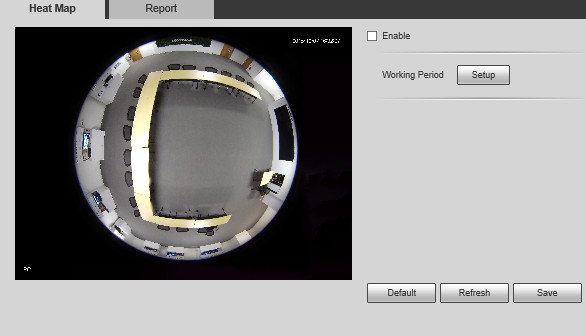
1. Login via web service.
2. Select the Setup tab.
3. Click on Event -> Click on heat map.
4. Check off enable
5. Click on setup to set working period.
6. You can set periods for each day. Click on save to save settings.
7. Click on report to view heat map report.
8. Select the time and date -> click on search. Max search time is 1 week (7 Days)
9. Click on export to export pictures.
Choose a place to save file
Note: Currently heat map function only supports 7-day heat map data, it will auto overwrite according to hour when surpassing 7 days. If users set flip mode, the previous heat map data will be cleared.
System Interface Setup
Prerequisites
Video Instructions
Step by Step Instructions
SmartPSS Setup
Prerequisites
- SmartPSS
- IVS capable device with heat map feature
- Camera added to the SmartPSS
- Latest firmware
Video Instructions
Step by Step Instructions
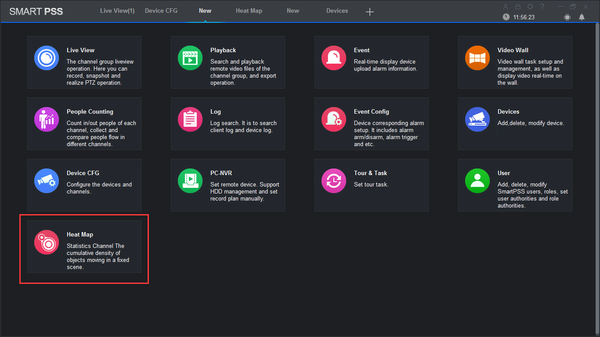
1. Click on the Heatmap in SmartPSS.


