Difference between revisions of ":Process/Reporting February"
(→Inbound Calls) |
|||
| Line 2: | Line 2: | ||
==Summary== | ==Summary== | ||
===Inbound Calls=== | ===Inbound Calls=== | ||
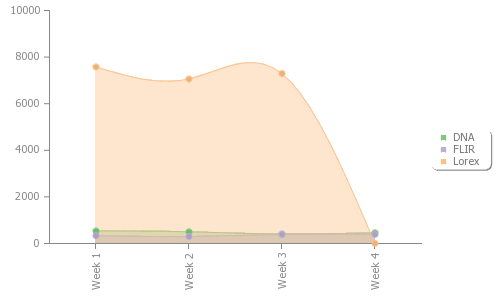
| − | < | + | <pLines ymin=0 ymax=10000 axiscolor=888888 cubic filled |
| − | + | angle=90 plots legend> | |
,DNA,FLIR,Lorex | ,DNA,FLIR,Lorex | ||
Week 1,537,334,7579 | Week 1,537,334,7579 | ||
| Line 9: | Line 9: | ||
Week 3,406,391,7292 | Week 3,406,391,7292 | ||
Week 4,461,389,0 | Week 4,461,389,0 | ||
| − | </ | + | </pLines> |
| + | |||
==Week 1: February 3 to 9== | ==Week 1: February 3 to 9== | ||
{| class="wikitable" | {| class="wikitable" | ||
Revision as of 17:08, 8 March 2019
Contents
February 2019
Summary
Inbound Calls
Week 1: February 3 to 9
| Type | Inbound Calls | Outbound Calls | Abandoned | Voicemails | Cases Created | Cases Closed | Escalated Cases | RMA Created | RMA Completed |
|---|---|---|---|---|---|---|---|---|---|
| Dahua North America | 537 | 80 | 102 | 14 | |||||
| FLIR | 334 | 31 | 0 | ||||||
| Lorex | 7579 | 658 | - | - | 7493 | 6590 | - | 580 | 489 |
| Empower | 2 | 1 | |||||||
| TOTAL |
Week 2: February 10 to 16
| Type | Inbound Calls | Outbound Calls | Abandoned | Voicemails | Cases Created | Cases Closed | Escalated Cases | RMA Created | RMA Completed |
|---|---|---|---|---|---|---|---|---|---|
| Dahua North America | 501 | 74 | 97 | ||||||
| FLIR | 300 | 19 | 0 | ||||||
| Lorex | 7063 | 661 | - | - | 7099 | 6330 | - | 535 | 397 |
| Empower | 3 | 0 | |||||||
| TOTAL |
Week 3: February 17 to 23
| Type | Inbound Calls | Outbound Calls | Abandoned | Voicemails | Cases Created | Cases Closed | Escalated Cases | RMA Created | RMA Completed |
|---|---|---|---|---|---|---|---|---|---|
| Dahua North America | 406 | 61 | 145 | ||||||
| FLIR | 391 | 17 | 0 | ||||||
| Lorex | 7292 | 773 | |||||||
| Empower | 4 | 1 | |||||||
| TOTAL |
Week 4: February 24 to March 2
| Type | Inbound Calls | Outbound Calls | Abandoned | Voicemails | Cases Created | Cases Closed | Escalated Cases | RMA Created | RMA Completed | CSAT Average | QA Average |
|---|---|---|---|---|---|---|---|---|---|---|---|
| Dahua North America | 461 | 68 | 59 | 578 | 236 | 5 | 2 | 6 | 80% | ||
| FLIR | 389 | 31 | 0 | 353 | 595 | 0 | 0 | 7 | N/A | ||
| Lorex | 6,632 | 12,094 | 418 | 248 | 90% | ||||||
| Empower | 3 | 0 | 0 | 5 | 0 | 0 | 0 | 1 | N/A | ||
| TOTAL | 7,568 | 12,925 | 420 | 262 | 85% |
Top 10-Problem Type
| Problem Type | Number of Cases Created |
|---|---|
| 1. | 1 |
| 2. | 1 |
| 3. | 1 |
| 4. | 1 |
| 5. | 1 |
| 6. | 1 |
| 7. | 1 |
| 8. | 1 |
| 9. | 1 |
| 10. | 1 |
| TOTAL | TOT |