Difference between revisions of "DSS S2/Client/Heatmap"
| Line 62: | Line 62: | ||
[[File:Heatmap_-_DSS_Client_-_8.jpg|600px]] | [[File:Heatmap_-_DSS_Client_-_8.jpg|600px]] | ||
| + | |||
| + | |||
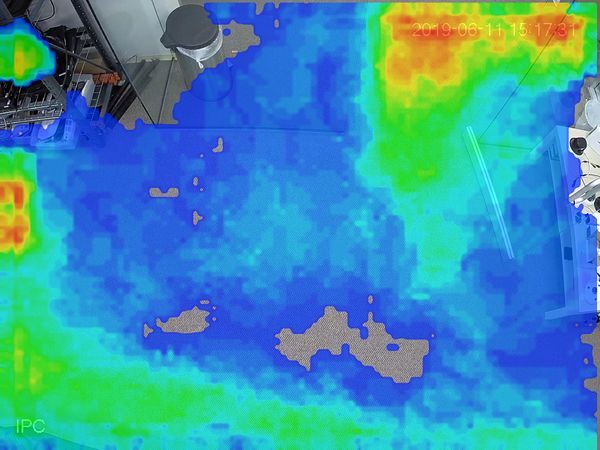
| + | ====Heatmap sample export:==== | ||
| + | |||
| + | [[File:Heatmap_IPC_20190611000000_20190611235959.jpg|600px]] | ||
Latest revision as of 22:25, 11 June 2019
Contents
Heatmap In DSS Client
Description
This article will show you how to use Heatmap in DSS Client
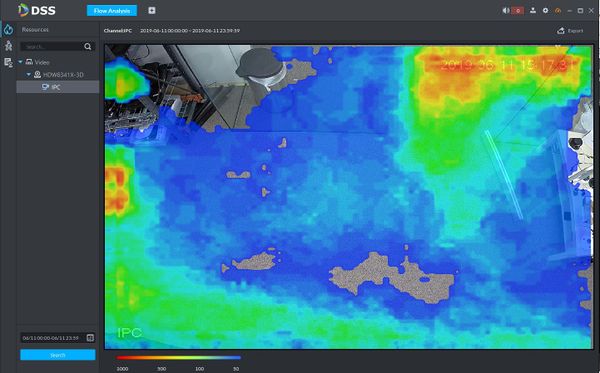
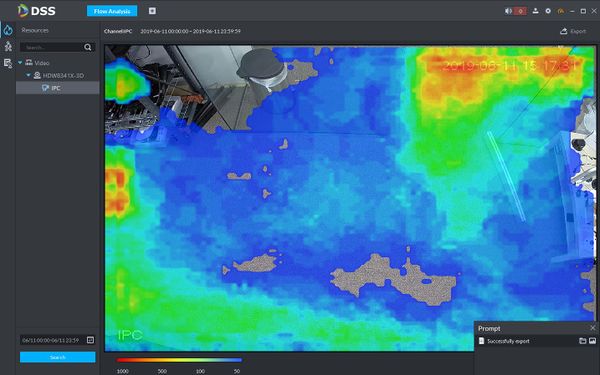
Heatmap displays the distribution of moving objects in colors of different shades. It reflects the range of activity regions by different colors, for example, red means the activity is relatively high and blue means the activity is relatively low
Note: The device sends heat map data to the platform on a real-time basis. You can search uploaded heat map data starting from the time the device was added to the server
Prerequisites
- DSS
- DSS Client
- Dahua device that supports Heatmap added to DSS Server
- Heatmap data (see Note above in Description)
Video Instructions
Coming Soon
Step by Step Instructions
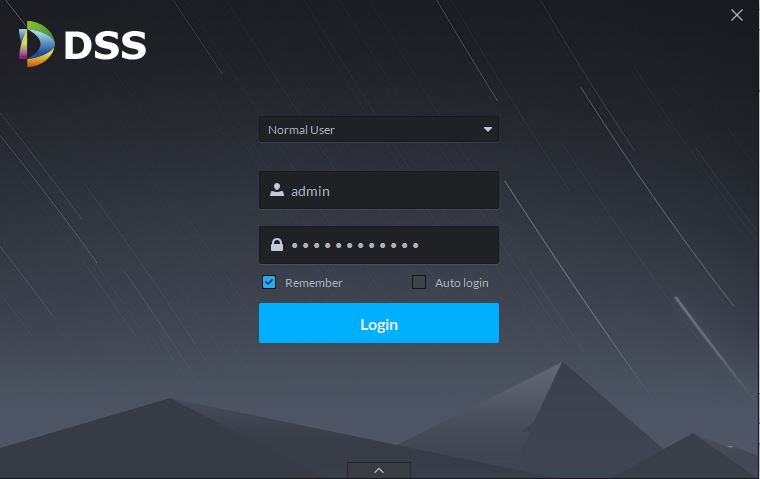
1. Launch and Log in to DSS Client
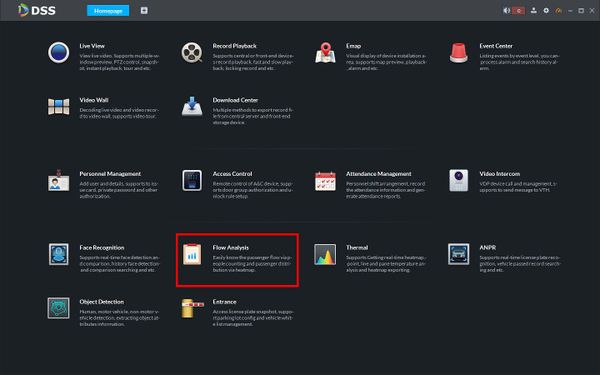
2. Click Flow Analysis
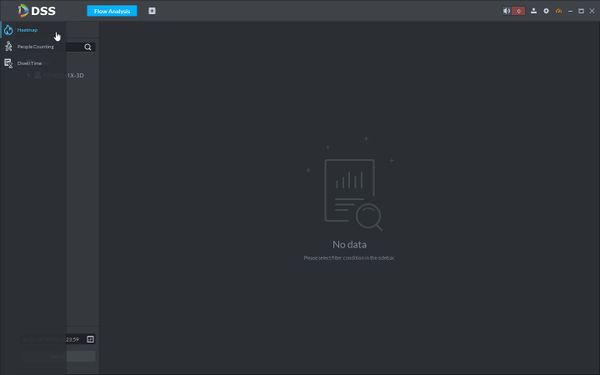
3. Hover the mouse towards the left side of the screen over File:Heatmap icon.jpg icon until the menu expands
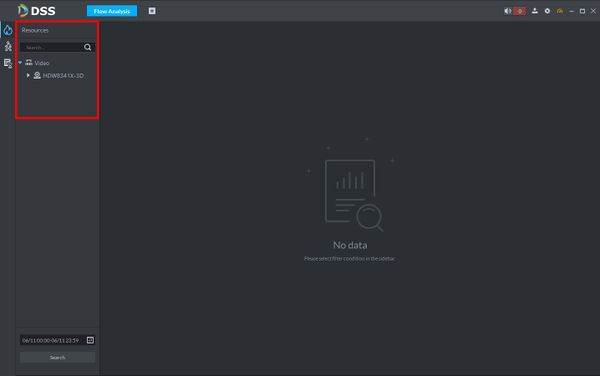
4. Devices that support the Heatmap feature that have been added to DSS will automatically appear in the Resources tree menu
Check the box next to the device you wish to query Dwell Time data from
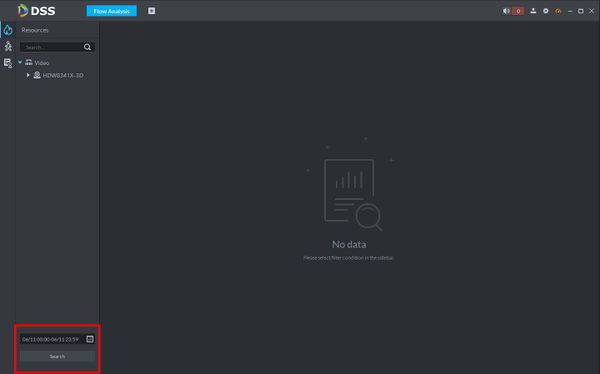
5. Use the drop down boxes in the lower left of the screen to select a date range to search
Click Search
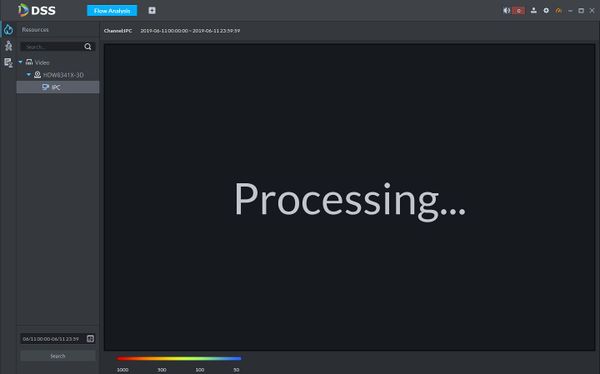
6. A message will display while the heatmap is generated
7. The heatmap data will be displayed in the center of the screen
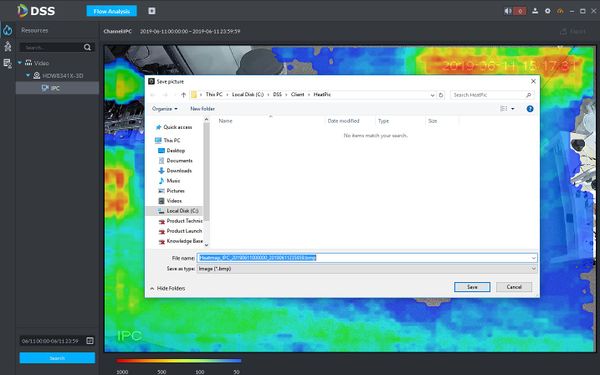
8. To export the heatmap data as a BMP image click Export in the top right of the screen
9. A window will appear asking where to save the report. Click Save
10. A prompt will appear when export is successful
