Difference between revisions of "DSS S2/Client/Heatmap"
| Line 27: | Line 27: | ||
[[File:People_Counting_Report_-_DSS_Client_-_1.jpg|600px]] | [[File:People_Counting_Report_-_DSS_Client_-_1.jpg|600px]] | ||
| + | |||
| + | 3. Hover the mouse towards the left side of the screen over [[File:heatmap_icon.jpg]] icon until the menu expands | ||
Revision as of 22:14, 11 June 2019
Contents
Heatmap In DSS Client
Description
This article will show you how to use Heatmap in DSS Client
Heatmap displays the distribution of moving objects in colors of different shades. It reflects the range of regions by different colors, for example, red means the activity is relatively high and blue means the activity is relatively low
Note: The device sends heat map data to the platform on a real-time basis. You can search uploaded heat map data starting from the time the device was added to the server
Prerequisites
- DSS
- DSS Client
- Dahua device that supports Heatmap added to DSS Server
- Heatmap data (see Note above in Description)
Video Instructions
Coming Soon
Step by Step Instructions
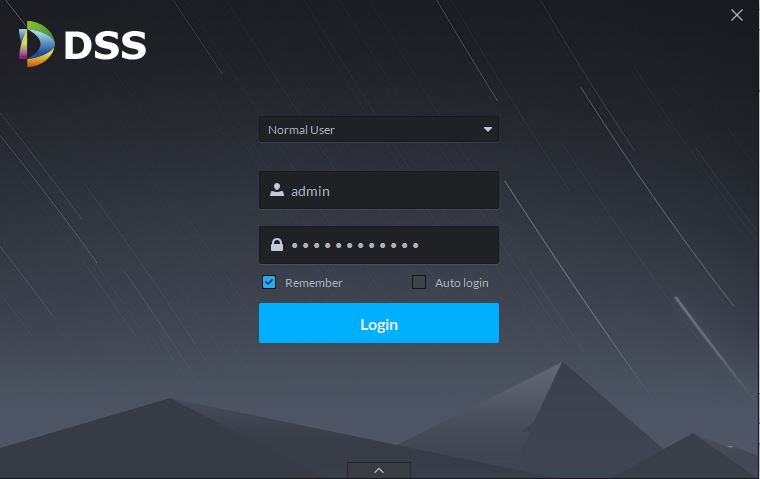
1. Launch and Log in to DSS Client
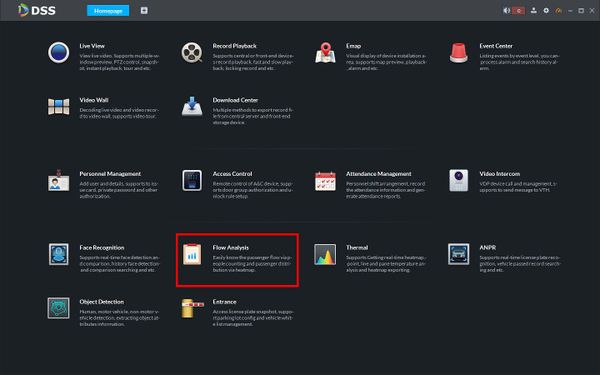
2. Click Flow Analysis
3. Hover the mouse towards the left side of the screen over File:Heatmap icon.jpg icon until the menu expands

